
The Amazon seller business of 2021 was a land grab. The Amazon seller business of 2026 is a yield business. Fewer active sellers. More of Amazon’s units still going through third parties. A much fatter take-rate on the ones who stayed — FBA, ads, storage, the whole “seller services” line that Amazon reports to Wall Street. If you are still shopping software like it is 2021, you are buying a chrome extension for a war that moved to P&L.
This is not a listicle of “47 crazy Amazon facts.” It is the four-and-a-half years we actually use when we tell you to keep Keepa, to stop paying Diamond on day one, and to treat ads as a cost of search, not a growth hack. Methodology sits on how we test. Fee mechanics sit on Amazon FBA fee history. What follows is the industry as a catalog operator lives it — not as a research voice note.
The one chart that should change how you buy tools
Amazon’s marketplace is not “turning 3P.” It already did. Marketplace Pulse’s latest reading: third-party sellers accounted for 60.0% of worldwide paid units in Q1 2026, a hair under the 61% a year earlier. That is not a startup statistic. That is the store.
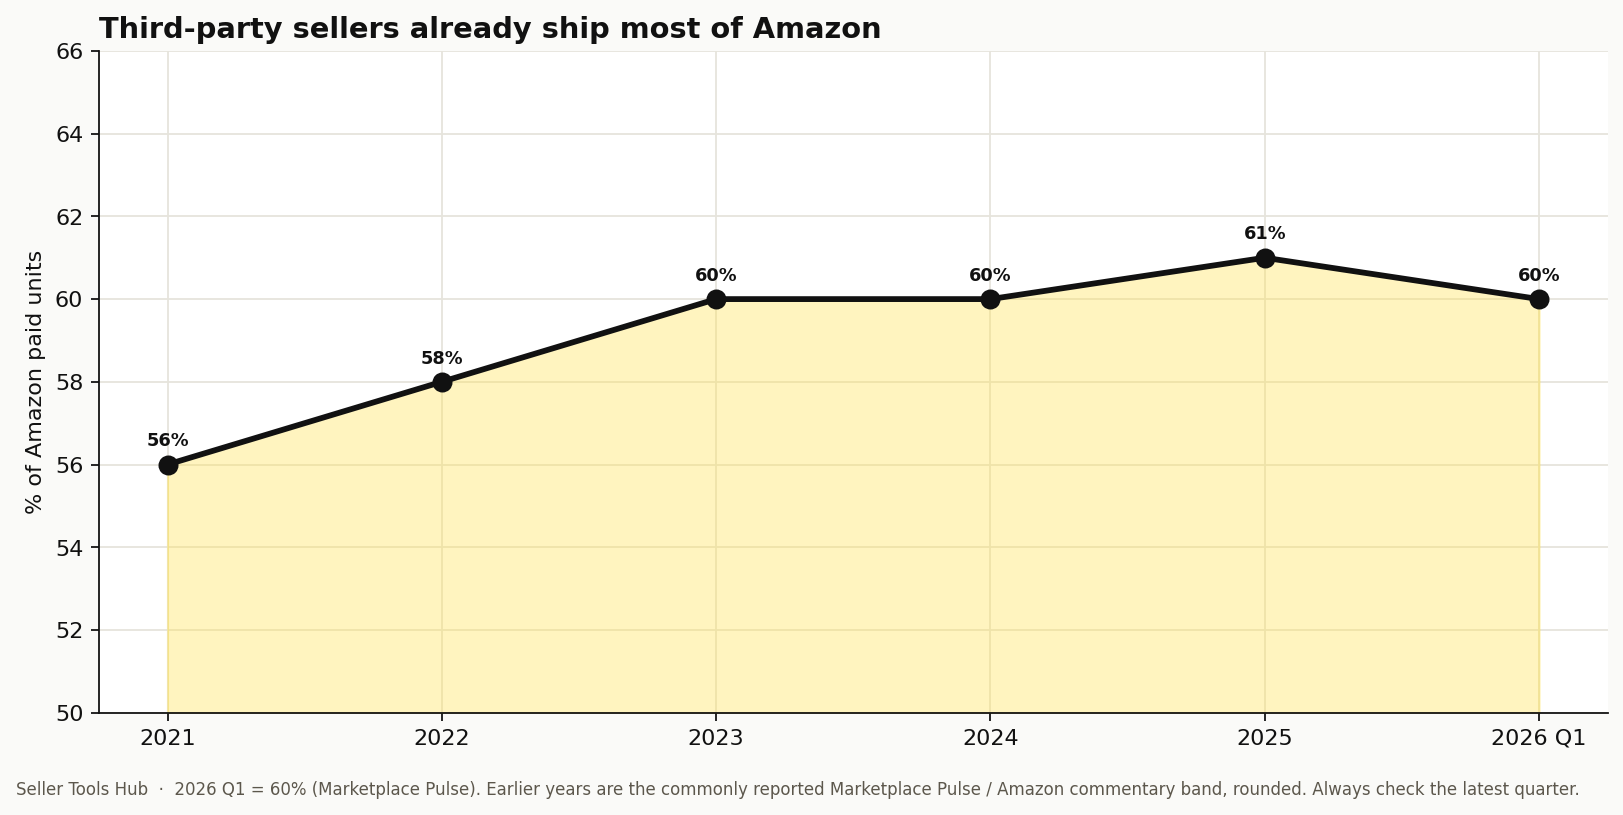
Read it the unpleasant way: Amazon does not need you to exist. It needs a seller to exist in each slot. The survivors take more traffic per account — industry recaps put traffic per active seller up about 31% since 2021 — because a lot of 2020–2021 accounts simply stopped shipping. You are not competing with 9 million registered storefronts. You are competing with the people who still buy inventory after Q4 storage and after a 3.5% fuel surcharge.
Amazon got richer on you. That is the seller-services line.
Amazon reports a bundle it calls third-party seller services: commissions, FBA and related fulfillment, and the other things it charges 3P. Marketplace Pulse’s compilation of the earnings:
| Year | 3P seller services | What it felt like on the shop floor |
|---|---|---|
| 2014 | $11.75 billion | FBA was still a decision. Plenty of people FBM’d the whole catalog. |
| 2015 | $16.09 billion | Referral + FBA becoming the default OS for anyone who wanted the Buy Box. |
| 2016 | $22.99 billion | The year a lot of private-label YouTube was filmed. Software was still a Chrome overlay. |
| 2024 | $156.15 billion | FBA, ads, storage, inbound — a stack, not a fee. |
| 2025 | $172.17 billion | +10% on an already huge base. Amazon’s 3P machine did not need more sellers. It needed the remaining ones to pay more. |
| 2026 Q1 | $41.58 billion | +14% year-over-year vs Q1 2025. The year is not slowing down. |
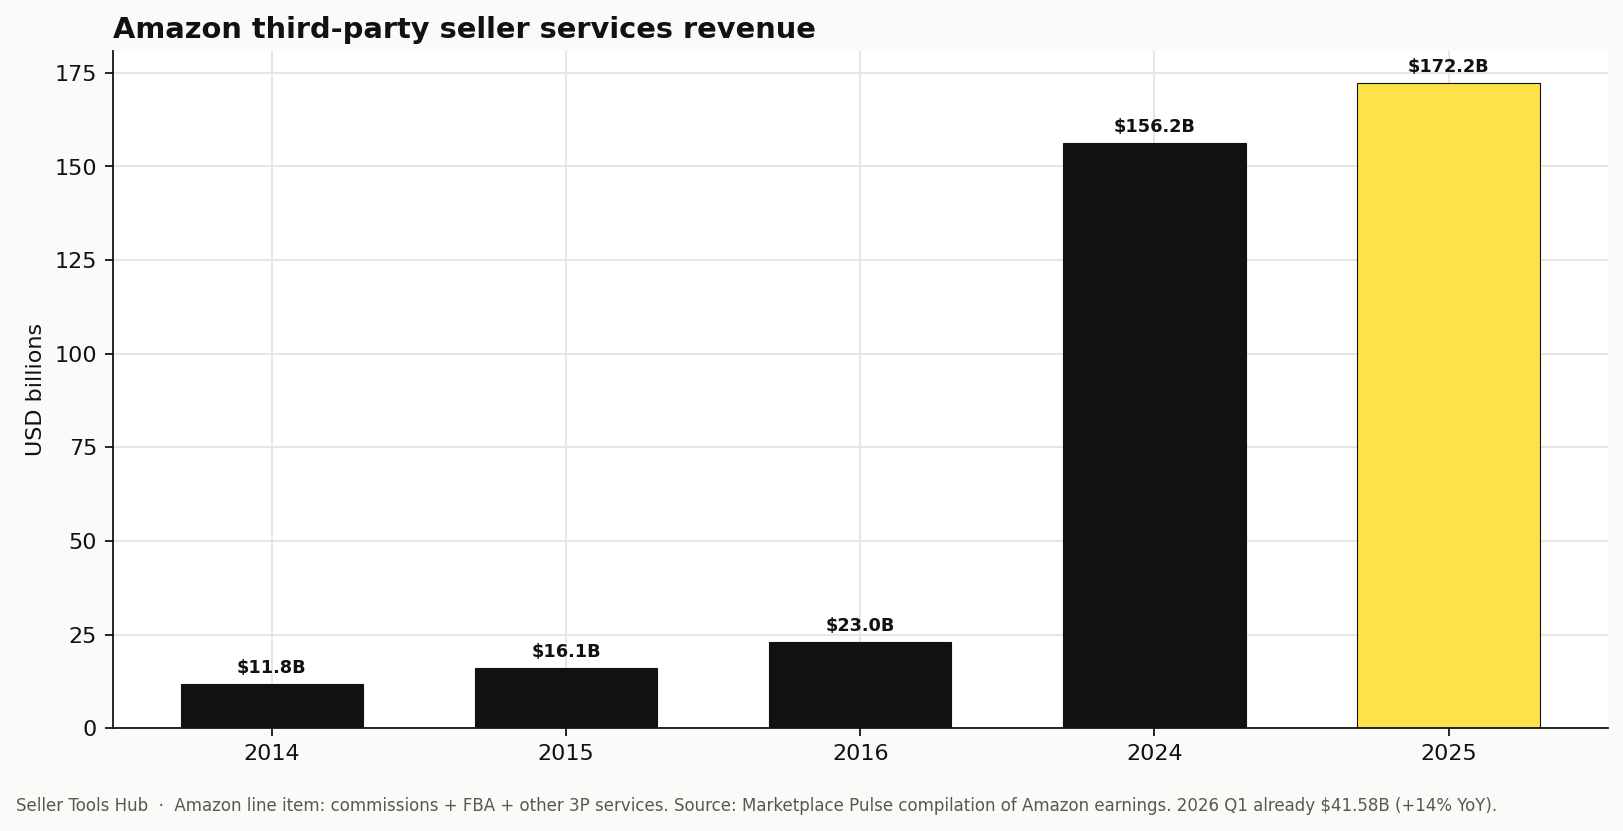
From $23 billion in 2016 to $172 billion in 2025 is not “the marketplace grew.” It is Amazon productizing every friction in your operation. That is why Sellerboard usually beats a suite’s profit tab in our reviews, and why a Helium 10 coupon on the wrong plan is still the wrong plan. See Helium 10 statistics and the Helium 10 review.
The seller count went the other way
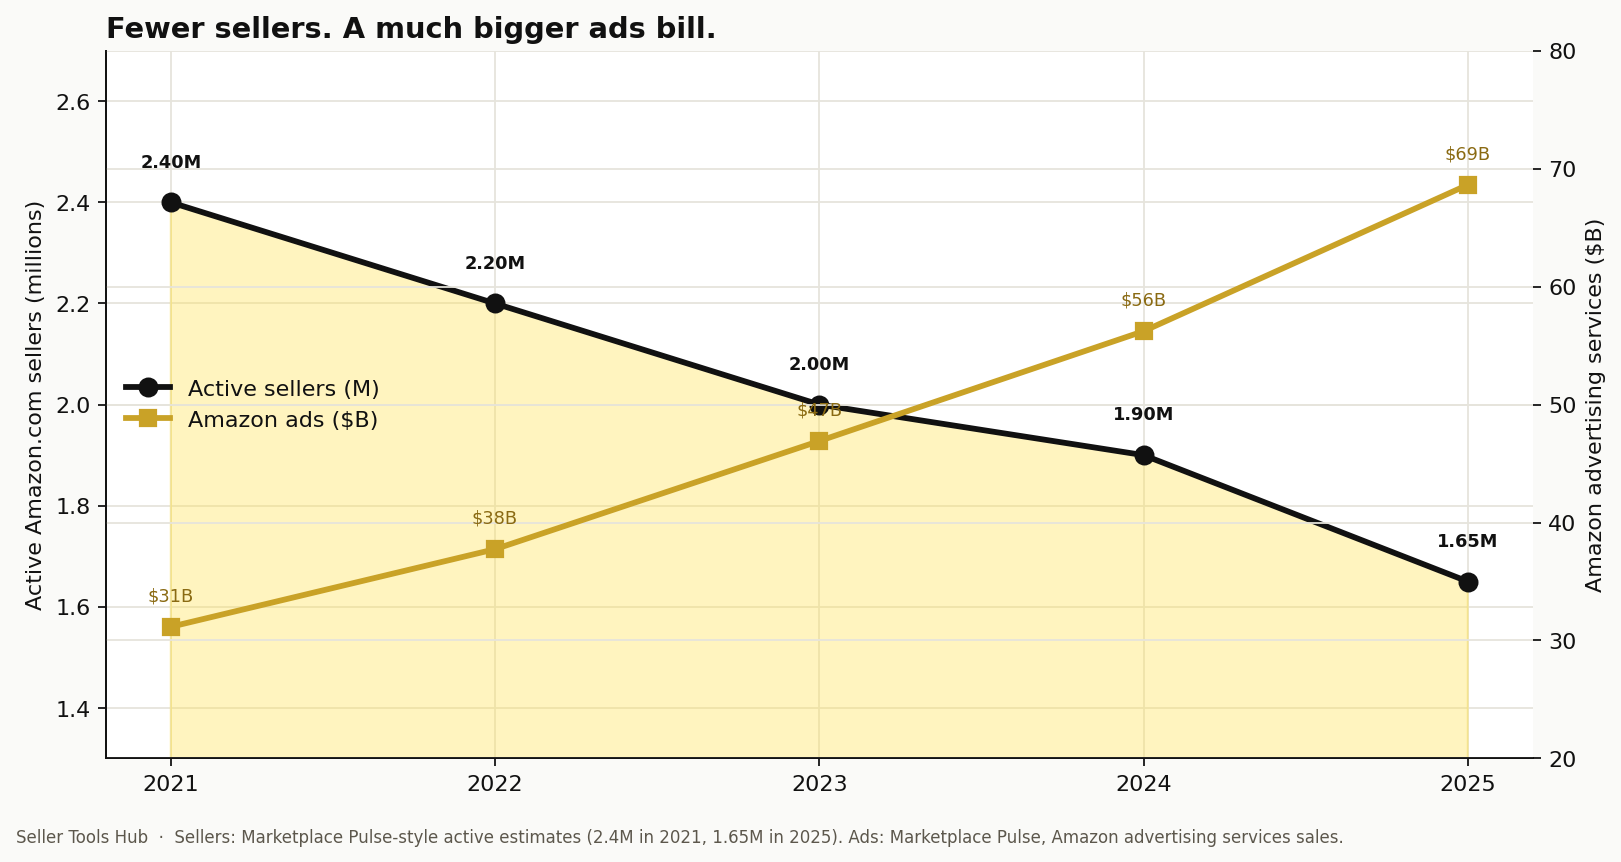
Marketplace Pulse estimates Amazon.com ended 2025 with about 1.65 million active sellers, down from 2.4 million in 2021. New registrations in 2025 were described as a decade low. The YouTube era imported a lot of people who could run a product launch webinar and could not survive a restock limit.
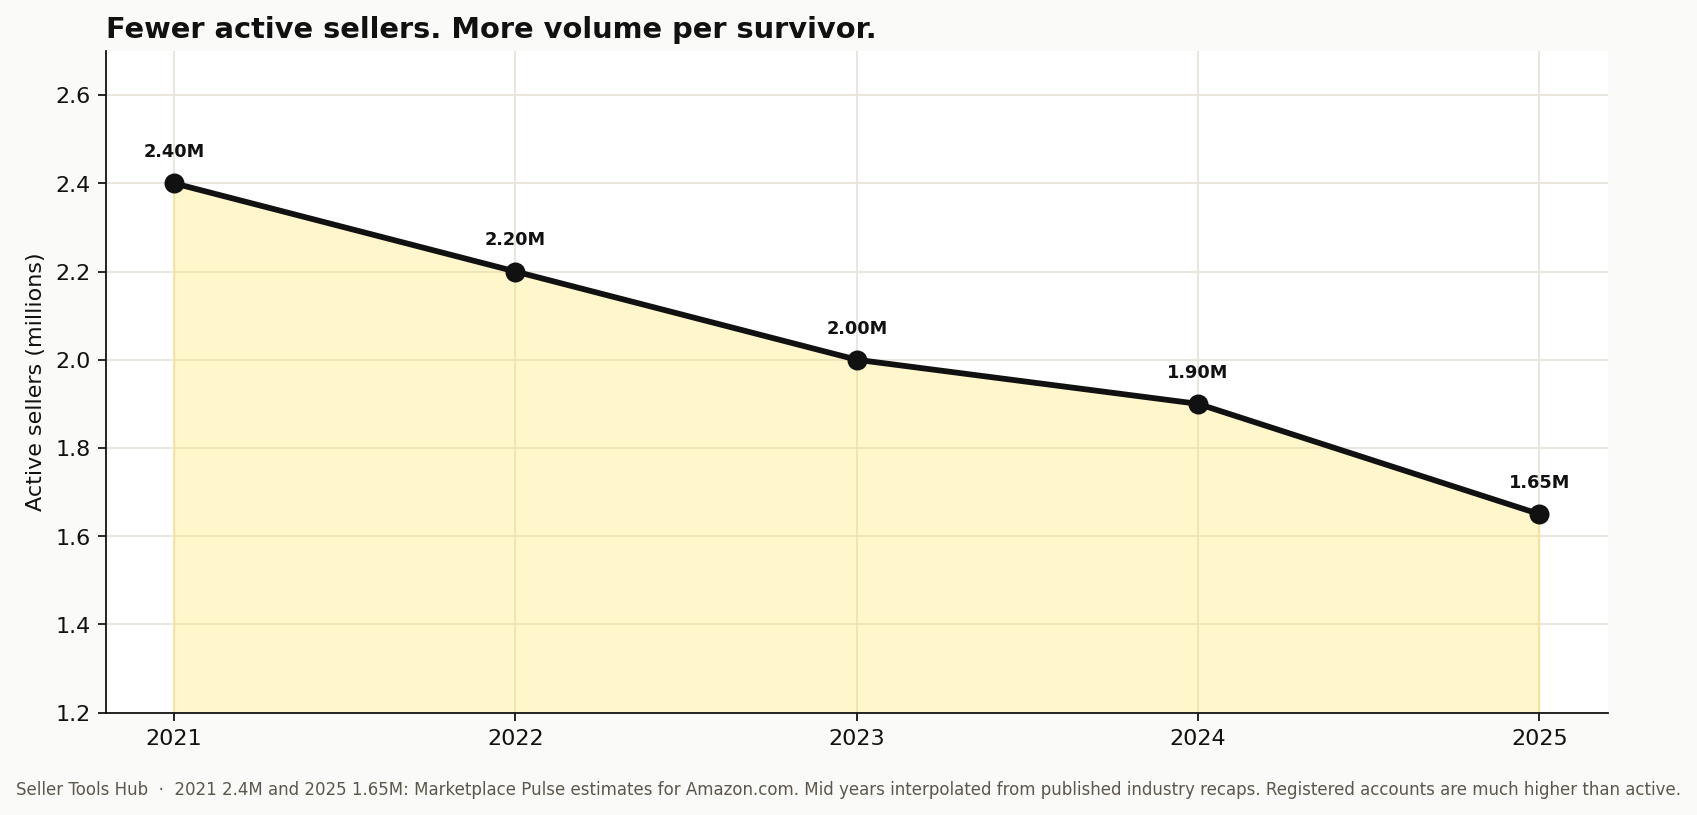
| Year | Active sellers (est.) | 3P unit share (band) | The job |
|---|---|---|---|
| 2021 | 2.4 million | ~56–57% | Launch. PPC was still “optional” in too many decks. |
| 2022 | ~2.2 million | ~58% | Inventory hangover. Fuel surcharge on FBA. First real software cull. |
| 2023 | ~2.0 million | ~60% | Storage utilization and aged fees. The year sitting became a product Amazon sells you. |
| 2024 | ~1.9 million | ~60% | Inbound placement fee. Off-peak storage cut. Ads still climbing. |
| 2025 | ~1.65–1.9 million | ~60–61% | Amazon paused most US FBA/referral hikes. The pause was not a strategy. It was a calendar. |
| 2026 Q1 | — | 60.0% | Fulfillment +$0.08 average, then a 3.5% fuel surcharge in April. Software spend is a line item. |
If your cousin wants to “start Amazon” in 2026 with a $400 Helium 10 annual and a Facebook ad for a kitchen gadget, send them the TACOS glossary and the profit calculator. The land grab is over. The people left are running yield.
Ads became a second rent
Amazon advertising services — sponsored, display, video, the whole retail-media pile — went from $31.16 billion in 2021 to $56.22 billion in 2024 to $68.63 billion in 2025 (Marketplace Pulse). Q1 2026 was $17.24 billion, +24% year-over-year. Jungle Scout’s 2025 seller survey (nearly 1,500 businesses, Jan 10–27 2025) put growing advertising expenses in the top handful of worries: 32% named it.
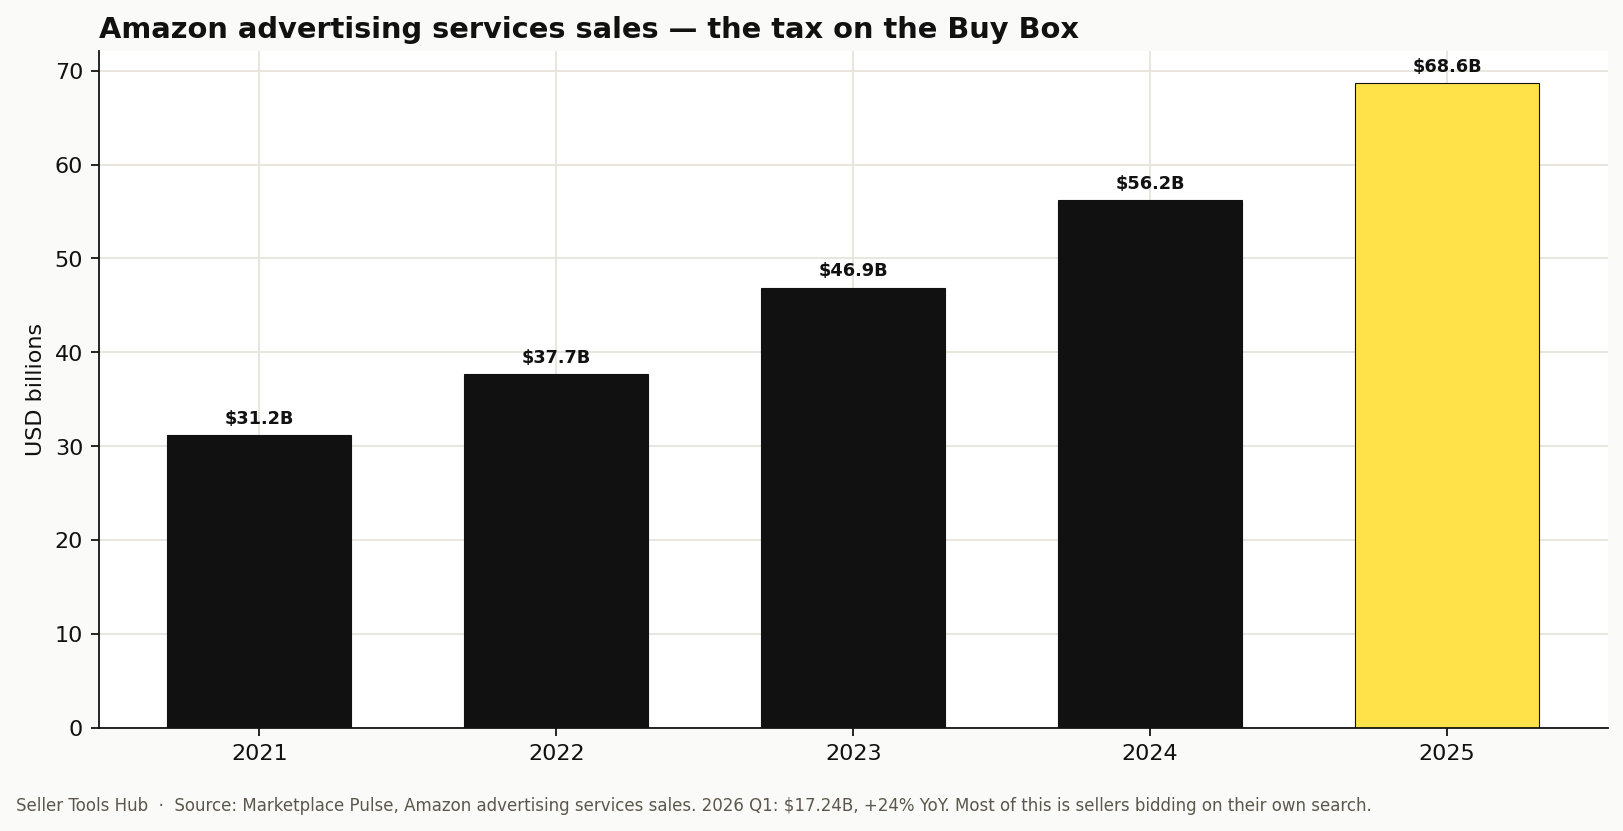
That is why we will not let a PPC tool review hide the fee. Helium 10 Ads (the thing that used to be Adtomic) lives on Diamond and takes a cut of spend — commonly 2%. On a $10k/month ads account that is another couple of thousand a year before you have discussed Cerebro. If the unit does not have contribution after FBA and referral, no bid rule will save it. Use the PPC bid calculator and TACOS calculator. ACOS is a campaign metric. TACOS is the business.
| Year | Amazon ads (Marketplace Pulse) | YoY | What it felt like on a listing |
|---|---|---|---|
| 2021 | $31.16 billion | — | PPC was still “optional” in too many launch decks. |
| 2022 | $37.74 billion | +21% | Ad budgets did not go back down with demand. |
| 2023 | $46.91 billion | +24% | Sponsored is how you rent the search you used to rank. |
| 2024 | $56.22 billion | +20% | Retail media is a second warehouse bill. |
| 2025 | $68.63 billion | +22% | Jungle Scout’s survey: 32% named growing ad expense as a top worry. |
| 2026 Q1 | $17.24 billion | +24% vs Q1 2025 | Do not annualize Q1 — Q4 is the ads quarter — but the slope is not a pause. |
If Q1’s +24% held all year you would be looking at something north of $80 billion in 2026. We will not print that as a forecast. Q4 does the heavy lifting on retail media, and a sloppy annualization is how Twitter threads get people to inbound. Treat $17.24B as the run-rate of the tax, then watch your own TACOS. The TACOS calculator is boring on purpose.
Jungle Scout’s 2024 and 2025 State of the Amazon Seller reports are the closest thing we have to a repeating seller census. 2024 surveyed nearly 2,000 businesses (1 Dec 2023 – 3 Jan 2024). 2025 surveyed nearly 1,500 across 20+ countries. The mood shift is not subtle: 2021 decks were about expansion. 2025 decks are about shipping costs (38% of respondents in JS’s 2025 cut), COGS (34%), ads (32%), and enterprise brands worrying about profitability because of rising costs (~40%). Sourcing from China got less fashionable; US sourcing nearly doubled in that survey’s telling. That is tariff and lead-time trauma showing up as a checkbox.
Margins: most of you are not printing 40%
Jungle Scout’s “How much do Amazon sellers make?” recap of their SMB sample: 57% report profit margins above 10%. 28% above 20%. 13% not currently profitable. The band table is the one we show new catalogs when they want to buy Diamond and a brand photographer in the same week.
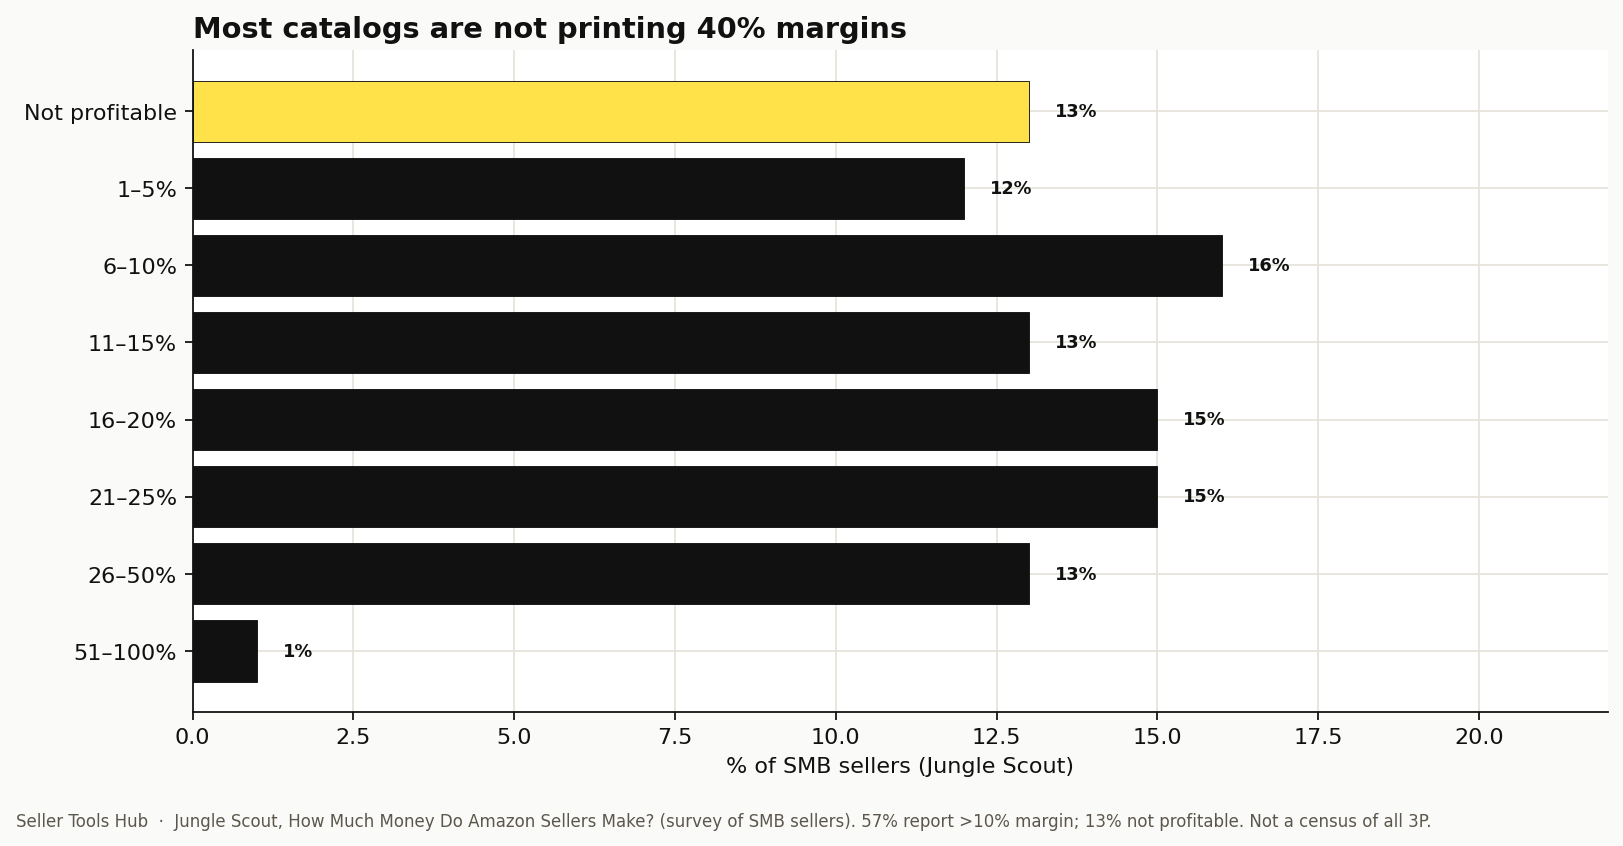
| Reported margin (SMB) | % of sellers (Jungle Scout) | What we tell them |
|---|---|---|
| Not profitable | 13% | Stop the suite. Keep Keepa. Fix the unit or kill the SKU. |
| 1–5% | 12% | You are a rounding error away from aged fees. No Diamond. |
| 6–10% | 16% | Respectable if volume is real. TACOS will decide the year. |
| 11–15% | 13% | The honest middle. Software should be a line, not a personality. |
| 16–20% | 15% | You can pay for Platinum annual and still sleep. |
| 21–25% | 15% | Do not get cute inbound in August. |
| 26–50% | 13% | Either a beautiful category or a spreadsheet lie. Check returns. |
| 51–100% | 1% | Send us the ASIN. We have questions. |
FBA remains the default fulfillment for anyone chasing Prime, even as a chunk of brands tell Jungle Scout they prefer more control. That split is why we still review FBM-adjacent inventory tools and why we still tell people a 90/100 opportunity score on a bulky unit is a toy. Size-tier is a strategy. See the fee history.
2021 → 2026: what actually changed in the workweek
2021. Stimulus, freight chaos, everyone had a “brand.” Jungle Scout’s older seller reports from that era were full of expansion intent — 96% planning to grow was the mood music in 2021. Software meant a research overlay and a wish. Keepa was already the adult in the room. Most people ignored it.
2022. Inventory bought at 2021 prices met 2022 demand. Amazon put a 5% fuel surcharge on FBA fulfillment in April and taught everyone that “temporary” is a billing product. Ad budgets did not go back down. This is when we started telling catalogs to pay monthly on suites until the workflow was muscle memory.
2023. Storage utilization. Aged inventory expanded into 180–270 days. The year sitting on a PO became a fee. Restock limits stopped being a forum complaint and became the growth cap. Inventory software went from nice-to-have to the reason you still have a Buy Box in January.
2024. Inbound placement fee (March). Off-peak storage cut $0.09 (April) — a real gift, immediately misunderstood as “storage is fine now.” Amazon ads crossed $56B. Jungle Scout’s 2024 survey (~2,000 businesses) is the document of that exhaustion: profitability and ads, not “what’s your launch stack.”
2025. Amazon paused most US FBA and referral hikes. Sellers heard “fees froze.” Amazon heard “do not pick a fight in a political year.” 3P services still printed $172B. Ads printed $69B. Active seller count kept bleeding. AI features showed up in every suite. We scored them as “useful, not magic” on the Helium 10 page because that is what they are.
2026. The OS updates resumed. January: average fulfillment +$0.08, ugly tails on small standard above $50, AWD West storage up, 456-day aged rung. April 17: 3.5% fuel/logistics surcharge on US and Canada FBA fulfillment. Q1 3P services +14%. Q1 ads +24%. If your 2026 budget assumed 2025’s pause was a philosophy, it was a date.
FBA is still the default. Control is the luxury.
Every year someone writes that FBM is “back.” A slice of Jungle Scout’s 2025 sample did say they prefer handling fulfillment themselves — the LinkedIn recaps floated around 37% wanting more control. That is not the same as 37% of units leaving FBA. Prime is still the badge. Buy Box still speaks FBA as a native language. We review FBM tools. We do not pretend you can FBM a mid-ticket consumable against a well-run FBA competitor and keep conversion.
What changed is the reason people flirt with FBM: Q4 storage, aged rungs, inbound placement, and the 3.5% surcharge. If your cubic feet are ugly, FBM is a size-tier strategy, not a religion. Model both. Use the storage calculator. If FBM wins by $0.20 and you lose the Buy Box four days a week, you did not win.
Where the remaining sellers actually make money
The 1.65 million who stayed are not evenly distributed. Private label still dominates the tool discourse because that is who buys Helium 10 annual. Wholesale and OA never left — they just do not post as much. SmartScout-type maps matter more when the catalog is a brand with a real category share. Keepa plus Tactical Arbitrage is still the OA sentence. We will not tell an OA seller to buy Diamond. We will tell them to stop running out of Keepa tokens.
International is the unglamorous growth. Adam-style operators (US/UK/DE) have been doing this since before 2021. 2025’s Jungle Scout sample covering 20+ countries is the reminder that fee cards are local. This page is US-weighted because that is the P&L we audit most. If you are on .DE, do not paste our $0.78 storage into your sheet. Open that marketplace’s help page.
Category mix shifted the way tariffs always shift it: fewer people brag about a container from Shenzhen as a personality. Jungle Scout’s 2025 note that 30% fewer businesses were sourcing from China while US sourcing nearly doubled is directionally the story operators tell in Slack. Lead times, landed cost, and “will this still be legal in October” are now product-research questions. A pretty BSR does not survive a 145% headline.
Software spend is now a line item. Treat it like one.
In 2021 you could hide $99 of Helium 10 under “marketing.” In 2026 the stack is visible next to FBA on a decent P&L. That is healthy. It is also why we write reviews that say skip. Paying three suites to do Keepa’s job is how catalogs that should have been fine end up “not currently profitable” in a Jungle Scout checkbox.
Rule we use on this site: pay monthly until the workflow is muscle memory, then annual on a real sale — Jungle Scout Black Friday, Helium 10’s yearly event, not a random 10% code. Helium 10 Black Friday is a tax holiday on a tool you were going to buy anyway. It is not a reason to upgrade into Diamond. The affiliate disclosure is in the footer. Commission does not move the bar.
What to do with this on Monday
Open Sellerboard (or whatever actually matches your settlements). Split last quarter into referral, FBA fulfillment, storage, ads, returns. If you cannot split it, that is the first software buy — not another research login.
Take the SKUs that made 80% of contribution and re-run them through the FBA calculator on the April 2026 surcharge. If a hero SKU dies, it dies. Xray will not attend the funeral.
Cut Q4 cover. If Keepa says you stock out in November without the extra inbound, that is a forecast conversation, not an August container conversation.
Read the Helium 10 review only after the unit works. Tools do not print margin. They show you where you already lost it.
What the stack should cost in 2026 (so you stop buying three suites)
A serious US private-label catalog in 2026 typically pays for four jobs, not one OS:
- Honesty on velocity — Keepa Data. Non-negotiable. Tokens running out mid-scan is how people buy ghosts.
- Keyword OS — Helium 10 Platinum or Jungle Scout if you want the saner UI and will accept a weaker reverse-ASIN. Annual, on Black Friday if you can wait. Live coupons.
- P&L — Sellerboard. The suite modules are fine. Morning truth is cleaner here.
- PPC — native Amazon until spend is real, then Helium 10 Ads (Diamond + % of spend) or a dedicated tool. Do not buy Diamond to “get the AI agent.” Buy it because ads are the job.
That stack is a few hundred dollars a month before Diamond, not $79 of wishful thinking. Dropshipping and POD people: you are not exempt. Minea / PipiAds will show you a creative. They will not pay your return rate. Roundups live in the journal under Guides.
How to use these numbers without lying to yourself
Unit share at 60% does not mean “easy.” It means Amazon’s 1P is not coming to save a mediocre listing. Seller-services at $172B does not mean “Amazon is on your side.” It means you are the crop. Ads at $69B means organic is an asset you rent back. Active sellers down from 2.4M to 1.65M means the graveyard is real — we wrote that up as the software graveyard because the same pattern hits tools.
When a vendor sends us a “state of the seller” deck, we check it against Marketplace Pulse and against Seller Central, then against a live catalog. That is how we test. If this page is missing a quarter, email [email protected]. We would rather correct a cell than keep a pretty chart.
A note on numbers we will not pretend to know
You will see other sites quote “9.7 million Amazon sellers” and “4,000 new sellers a day.” Registered is not active. A storefront that last shipped in 2022 still sits in a scrape. We use Marketplace Pulse’s active series because it matches what operators feel: fewer people sending inbound, more volume on the ones who do. If Amazon publishes a cleaner active-seller census tomorrow, we will swap the chart and say so at the top.
We will also not invent a single “average Amazon seller income” for 2026. Jungle Scout’s margin bands are a survey of people who answered a survey. Sellerboard on your own account is better data than any headline number. The 57% above 10% margin is useful as a sanity check when a course promises 40%. It is not a forecast for your ASIN.
Same honesty on ads. Amazon’s $68.63 billion advertising line includes vendors, authors, agencies, DSP. A huge share is still 3P sellers buying the search they used to rank organically. Your TACOS is the only ads statistic that can fire a SKU. The TACOS calculator is boring on purpose.
Fee history and seller statistics are the same story from two ends. Amazon got better at charging the remaining catalogs. The remaining catalogs got better at not dying. Software in the middle either tells you the truth or it sells you a dashboard. We know which one we are supposed to be.
Questions catalogs ask us about “the Amazon stats”
- How many Amazon sellers are there in 2026?
- Depends if you mean registered or active. Scrapes still quote “9 million+ storefronts.” Marketplace Pulse’s series is the one that matches the shop floor: about 2.4 million active Amazon.com sellers in 2021, about 1.65 million by end-2025. New registrations in 2025 were described as a decade low. We will not invent a Q2 2026 active count Amazon has not published.
- What percentage of Amazon units are third-party?
- 60.0% in Q1 2026, per Marketplace Pulse, versus 61.0% a year earlier. The marketplace already turned 3P. Amazon’s job now is taking more per remaining seller — FBA, ads, storage — not minting more storefronts.
- How much do Amazon sellers make?
- There is no honest single number. Jungle Scout’s SMB survey: 57% report margins above 10%, 28% above 20%, 13% not currently profitable. That is people who answered a survey, not a tax filing. Sellerboard on your own account beats any headline. A course that promises 40% is selling a different year.
- How big is Amazon advertising now?
- $68.63 billion in 2025, from $31.16 billion in 2021 (Marketplace Pulse). Q1 2026 was $17.24 billion, +24% year-over-year. A huge share is still 3P sellers buying the search they used to rank organically. Your TACOS is the only ads statistic that can fire a SKU.
- What software stack matches this industry, not 2021 YouTube?
- Keepa Data. Helium 10 Platinum or Jungle Scout for keywords — annual on a real sale, not Diamond because a coupon exists. Sellerboard for morning truth. Native Amazon PPC until spend is real. Read the Helium 10 review, the Helium 10 statistics, and FBA fee history before you pay anyone for a “launch OS.”
Sources
- Marketplace Pulse, “Amazon Percent of Units by Third-Party Sellers” — 60.0% in 2026 Q1, vs 61.0% a year earlier. marketplacepulse.com
- Marketplace Pulse, “Amazon Third-Party Seller Services Sales” — $11.75B (2014), $16.09B (2015), $22.99B (2016), $156.15B (2024), $172.17B (2025), $41.58B (2026 Q1, +14% YoY). marketplacepulse.com
- Marketplace Pulse, “Amazon Advertising Services Sales” — $31.16B (2021), $37.74B (2022), $46.91B (2023), $56.22B (2024), $68.63B (2025); 2026 Q1 $17.24B (+24% YoY). marketplacepulse.com
- Jungle Scout, State of the Amazon Seller 2025 — survey of nearly 1,500 sellers (10–27 Jan 2025); shipping, COGS, and ads concerns. junglescout.com
- Jungle Scout, “How Much Money Do Amazon Sellers Make?” — SMB margin bands (57% above 10%; 13% not profitable). junglescout.com
- Marketplace Pulse estimates of Amazon.com active sellers (2.4M in 2021; ~1.65M by end-2025) as reported in 2026 recaps of their seller-count series. Pair with Amazon Seller Central for fee changes — see our FBA fee history.